Optical Glass Properties
The properties and characteristics of Ohara optical glass necessary for glass handling.
The properties and characteristics of Ohara optical glass necessary for glass handling.
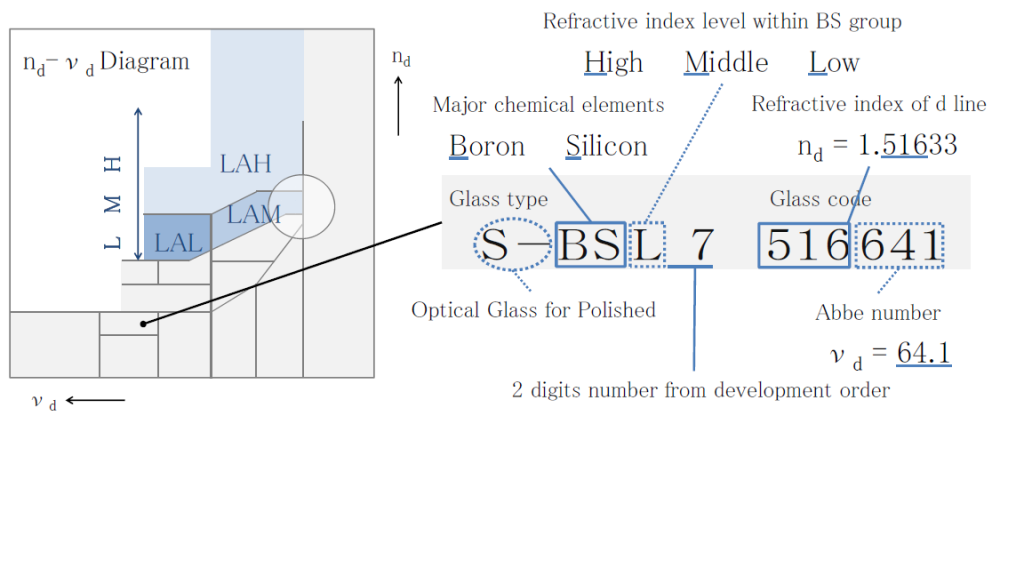
Each optical glass has its own properties which are closely connected to the key chemical elements contained therein. In OHARA’s glass type designation system the first or second characters include the atomic symbols of one or two important chemical elements for that glass type. The third letter of the glass type designation refers to the refractive index of each glass type within its glass group: H, M or L for high, middle, or low index . Lastly we assign a one or two digit number to each glass type within a given glass family. Thus each glass type is typically represented by three letters plus a one or two digit number. The prefix “S-“ stands for environmentally safe and the prefix “L-“ is used for low transformation temperature (Tg) glass types. The suffix “Y” is used for i-Line-glass types and the suffix “W” is used for glasses with improved transmittance. For example, the glass type S-BSL 7 is environmentally safe (S-), contains Boron (B) and Silicon (S), shows a low index (L) and is the seventh (7) glass within this BS glass family . Along with OHARA’s glass type designation, each single glass type is identified by a six digit code. The first three digits represent the refractive index at the helium line (nd) and the last three digits represent the Abbe number (νd). This six digit code is internationally recognized within the optical community.
When light enters the glass, it slows down inversely proportional to the refractive index compared to in a vacuum or in air. The refractive index of optical glass is usually expressed as the speed ratio of light in the air to themedium (glass sample).
The refractive index is measured by sending a predetermined wavelength of light into the sample and measuring theminimum deviation angle of the emitted light bent by refraction, according to JIS B 7071-1. For the 20 spectral lines shown in the table below, numerical values are shown to five decimal places. The refractive indices (principal refractive indices) for d-line (587.56 nm) and e-line (546.07 nm) are also shown to six decimal places.
| Spectral Line Symbol | t | ||||
| Light Source | Hg | Hg | Hg | Hg | Hg |
| Wavelength (nm) | 2325.42 | 1970.09 | 1529.58 | 1128.64 | 1013.98 |
| Spectral Line Symbol | s | A′ | r | C | C′ |
| Light Source | Cs | K | He | H | Cd |
| Wavelength (nm) | 852.11 | 768.19 | 706.52 | 656.27 | 643.85 |
| Spectral Line Symbol | He-Ne | D | d | e | F |
| Light Source | レーザー | Na | He | Hg | H |
| Wavelength (nm) | 632.8 | 589.29 | 587.56 | 546.07 | 486.13 |
| Spectral Line Symbol | F′ | He-Cd | g | h | i |
| Light Source | Cd | レーザー | Hg | Hg | Hg |
| Wavelength (nm) | 479.99 | 441.57 | 435.835 | 404.656 | 365.015 |
The refractive index for wavelengths not listed in the data sheet can be calculated using the dispersion formula. The Sellmeier equation is used as a practical dispersion formula, as detailed below.
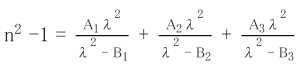
| n : | Refractive index to be calculated |
| λ : | Arbitrary wavelength (μm) |
| A1、A2、A3、B1、B2、B3 : | Constant (listed in the data sheet) |
Using this dispersion formula and the constants for each glass type, the refractive index of any wavelength in the standard measurement wavelength range (365 to 2325 nm) can be calculated with a calculation accuracy of ±5×10<sup>-6</sup>. However, for glass types for which the refractive indices for the entire standard measurement wavelength range are not listed in the data sheet, the applicable wavelength range of the dispersion formula is limited to the refractive index range listed in the data sheet.
“Internal transmittance” refers to the spectral transmittance of the glass itself, not including reflection losses at the optical glass-air interface; it indicates the transparency of the glass. Most optical glasses absorb a substantial amount of light in the near-ultraviolet region. For some glasses, especially those with a high refractive index, this absorption range also extends into the visible range. This absorption is not only caused by the composition of the glass; it is also affected by impurities in the glass, and varies slightly from melt to melt.
The spectral transmittance (including reflection loss) is measured based on the JOGIS-17 standard at wavelengths from 280 nm to 2400 nm in a pair of glass samples with different distances through which transmitted light passes. Then, the internal transmittance 〔τ<sub>i</sub>(10 mm)〕 at a glass sample thickness of 10 mm is calculated from the measurement data.
CCI (Color Contribution Index) is an index for predicting how much the color of a photograph taken using a certain lens system changes compared to the original color, due to the spectral characteristics of the lens. It is indicated by a set of 3 numbers for blue (B) / green (G) / red (R). Ohara uses this index to predict how much the color will change as a single glass element. For the measurement method, refer to JIS B 7097 “How to express the color characteristics of a photographic lens by the ISO color characteristic index (ISO / CCI)”. The numbers shown are calculated using the sum of the values of the internal transmittance of the glass sample every 10 nm and the average color film weighted spectral sensitivity, described in JIS. For example, B / G / R of 0/3/5, is shown in Fig. 4 in trilinear coordinates.

Dispersion refers to the phenomenon arising from a variation in the refractive index depending on the wavelength. Here, nF-nC and nF’-nC’are displayed as the main dispersion. The Abbe number is an index of the magnitude of the variance and is also called the inverse dispersion rate. The larger the variance, the smaller the Abbe number.

The glass type data sheet indicates the dispersion, calculated from the refractive index to six decimal places . Abbe number is indicated to two decimal places, this is the result of the calculation from nd to six decimal places and the principal dispersion to six decimal places .
Two decimal places: This is the result of calculation from nd to six decimal places (with seven effective digits) and the principal dispersion to six decimal places (with four or more effective digits).
The temperature coefficient of refractive index of each glass type is measured as Δnabs/ΔT according to ISO 6760-1 and from this value the Δnrel/ΔT value normally used in optical design is calculated. The relationship between Δn abs/ΔT and Δn rel/ΔT is given by the following formula.
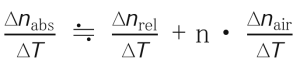
n :Refractive index of glass sample (in air, 25 ° C)
Coloring refers to the degree of coloration of the optical glass and is determined by measuring the spectral transmittance, including reflection losses, for a glass sample with a thickness of 10 mm, according to JOGIS-02. From the spectral transmittance curve (Fig. 3), the wavelengths showing the transmittance of 80% and 5%, respectively, are rounded and displayed in 5 nm units. We use this rounding method: the range 0 nm to 2 nm counts as 0 nm, the range 3 nm to 7 nm counts as 5 nm, the range 8 nm to 10 nm counts as 10 nm . For example, if the wavelength with 80% transmittance is 403 nm and the wavelength with 5% transmittance is 357 nm, the coloring is shown as 405/355.

For glass types with a high refractive index, nd ≥ 1.84, the reflection loss is large, so the wavelength showing transmittance of 70 % is used, instead of 80 %, and the value is shown in paranethesis. For example, (415).
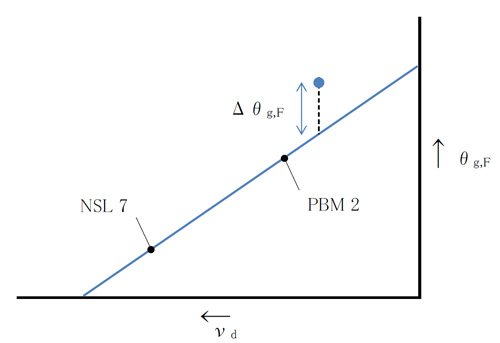
Although NSL 7 and PBM 2 are not currently produced by Ohara, the conventional NSL 7 and PBM 2 values (Table 2) are used as the reference values.
Reference Values
θc,t |
θC,A' |
θg,d |
θg,F |
θi,g |
vd |
|
NSL 7 |
0.8305 |
0.3492 |
1.2391 |
0.5436 |
1.2185 |
60.49 |
PBM 2 |
0.7168 |
0.3198 |
1.2894 |
0.5828 |
1.4214 |
36.26 |
>θg,F-νd図とΔθg,F
The temperature coefficient of the absolute refractive index of glass for wavelengths not listed in the data sheet can be calculated as a function of wavelength and temperature. Ohara uses the following equation.
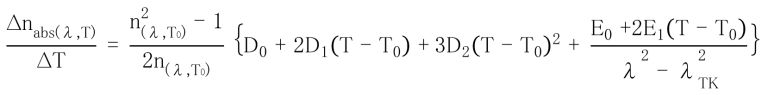
| n(λ,T0): | Refractive index at reference temperature |
| T0: | Reference temperature (°C) (Ohara defines this as 25°C) |
| T: | Target temperature (°C) |
| λ: | Vacuum wavelength (μm) |
| D0、D1、 D2、E0、 E1、λTK: | Constant (listed in the data sheet) |
To determine the temperature coefficient of the relative refractive index, refer to the equation given in the previous section, “Temperature coefficient of the refractive index”.
The strain point is the maximum temperature at which the viscous flow of glass is not possible, and at which the internal strain (residual stress) cannot be removed even by annealing (at or below the strain point). This is the temperature where the viscosity is 1014.5 dPa·s {poise}. The fiber elongation method is used for measurement, with reference to JIS R 3103-2.
The softening point is the temperature at which glass deforms under its own weight and is the lower limit temperature for glass molding and pressing. The glass viscosity is 107.65 dPa · s {poise} at this temperature.
The strain point is the maximum temperature at which the viscous flow of glass is not possible, and at which the internal strain (residual stress) cannot be removed even by annealing (at or below the strain point). This is the temperature where the viscosity is 1014.5 dPa·s {poise}. The fiber elongation method is used for measurement, with reference to JIS R 3103-2.
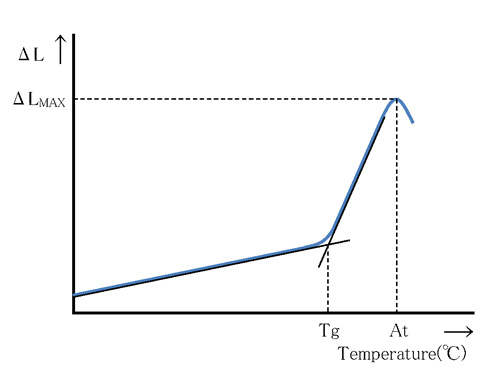
The average coefficient of linear expansion is the rate of elongation of a glass sample between two specified temperatures per 1 K. The average coefficient of linear expansion is measured via the method referred to in JOGIS-16 and JOGIS-08. The thermal expansion curve is obtained by measuring a well annealed glass sample, size 4.5 mm diameter by 25 mm long, heated at a constant rate of 4K per minute over the entire temperature range. From the temperature and elongation of the glass sample, the mean linear coefficient of thermal expansion is determined and shown up to the first integer in units of 10-7K-1 for 3 temperature ranges; –30℃ to +70℃, +100℃ to +300℃, and -100℃ to +300℃ for each 10℃ increment.
The transformation point is one of the state changes of glass, and refers to the temperature at which the glass transforms from an amorphous “solid” to a supercooled “liquid”, and the expansion characteristics change at this temperature.
Thermal conductivity is a numerical value that indicates the ease with which heat can be transferred within a single substance.
It is the amount of heat that flows in a unit time, through the unit area of the plate, when there is a temperature difference between both ends of the plate.
The measurement method uses the transient hot wire method, and the value of the glass sample at 35 ℃ is displayed to three significant digits.
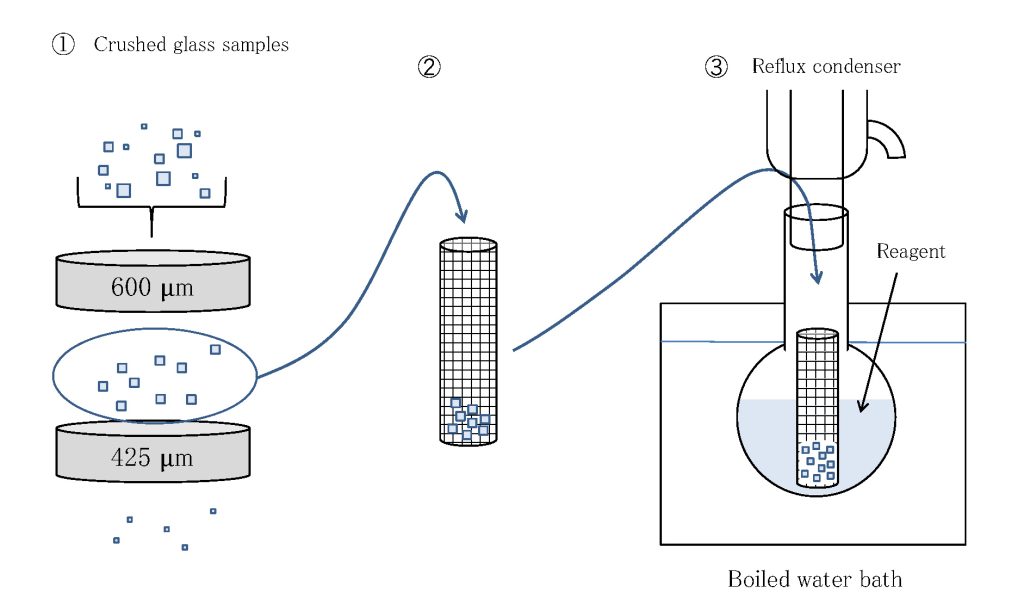
Water resistance 〔RW (P)〕 and acid resistance 〔RA (P)〕 by powder method Water resistance RW (P) is a measure of the likelihood of “white discoloration”, and acid resistance RA (P) is a measure of the likelihood of “blue discoloration”, occuring on the surface of the glass. These tests are conducted in accordance with the methods in ISO 21575 (water resistance) and ISO 8424 (acid resistance). The glass to be tested is crushed to 425 μm ~ 600 μm grains. A sample of this powder equivalent to the specific gravity in grams is placed on a platinum basket . This is put in a flask of silica glass containing the reagent and boiled for 60 minutes . The sample is then carefully dried and re-weighed to determine the loss of mass% and classified as per Table .
| ※ Water resistance RW(P) ・・・ | Pure water (pH6.5~ 7.5) |
| Acid resistance RA(P) ・・・ | 0.01 N aqueous nitric acid solution |
| Class | 1 | 2 | 3 | 4 | 5 | 6 |
| mass loss(%) | <0.05 | ≧0.05 <0.10 | ≧0.10 <0.25 | ≧0.25 <0.60 | ≧0.60<1.10 | ≧1.10 |
RA (P)
| Class | 1 | 2 | 3 | 4 | 5 | 6 |
| mass loss(%) | <0.20 | ≧0.20 <0.35 | ≧0.35 <0.65 | ≧0.65 <1.20 | ≧1.20 <2.20 | ≧2.20 |
| Phosphate resistance class PR | 1 | 2 | 3 | 4 |
| The time decreases a surface layer at a depth of 0.1μm(min) | >240 | ≦240 ≧ 60 | <60 ≧15 | <15 |
| Class | Constant temperature and humidity chamber | Illuminance at being observed | |
| Time | 1500lux | 100lux | |
| 1 | 24hr | ○ | - |
| 2 | × | ○ | |
| 3 | - | × | |
| 4 | 6hr | - | × |
Acid-resistant SR is a measure of the likelihood of “blue discoloration” or elution occuring on the surface of the glass using an acidic solution.
The test method is based on ISO 8424. The glass samples size 30 x 30 x 3 mm with 6 faces polished, are hung into nitric acid solution (pH 0 .3) or acetic acid buffer solution (pH 4 .6) at 25 °C for specified time (10 minutes, 100 minutes, 16 hours, 100 hours).
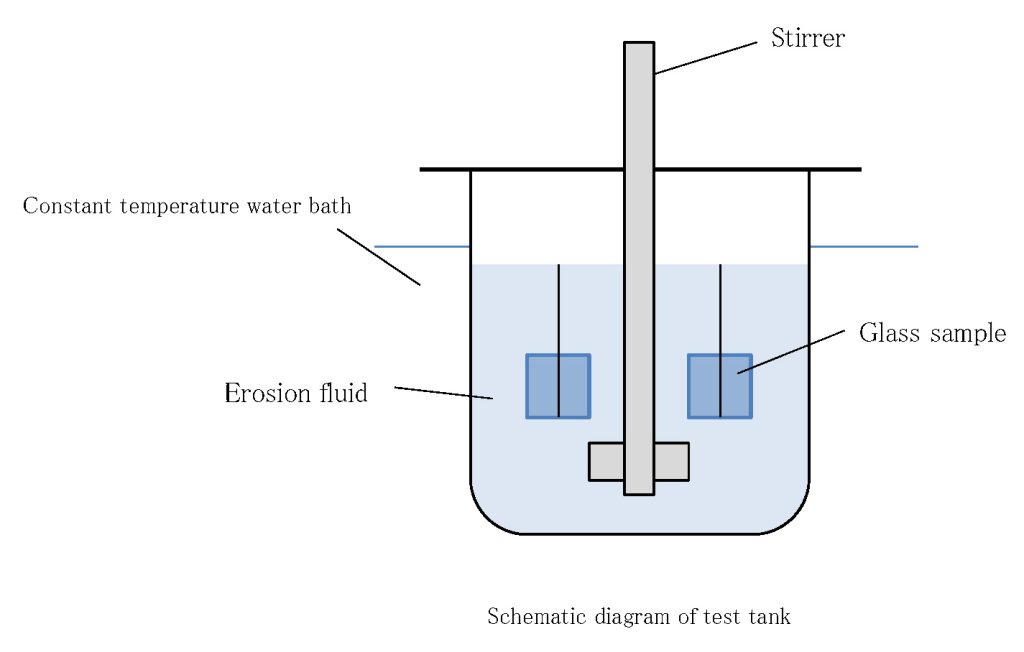
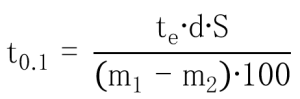
The calculation is carried out by use of the value of the loss of mass which is observed by the minimum test condition (i.e.,test solution and test time) for obtaining a loss of mass greater than 1mg / sample. If the loss of mass is less than 1mg / sample after 100 hours exposure to pH 0.3, this value shall be accepted. The acid resistance class SR is obtained by comparison of the pH of the erosion fluid and the time required for the attack to a depth of 0.1μm (h) with time scales given in the classification Table 6.
| t0.1 : | the time (h) decreases a surface layer at a depth of 0.1μm |
| te : | the time (h) for attack in the experiment |
| d : | the specific gravity of the sample(g/cm3) |
| S : | the surface area (cm2) of the sample |
| m1, m2 : | the mass (mg) of the sample before and after the test |
| Acid resistance class SR | 1 | 2 | 3 | 4 | 5 | 51 | 52 | 53 | |
| attacking solution | nitric acid solution (pH 0.3) | acetic acid buffer solution (pH 4.6) | |||||||
| The time(h) decreases a surface layer at a depth of 0.1μm | >100 | ≦100 ≧10 | <10 ≧1 | <1 ≧0.1 | <0.1 | >10 | ≦10 ≧1 | <1 ≧0.1 | <0.1 |
| Additional Number | Changes in the Surface |
| .0 | No visible changes |
| .1 | Clear, but irregular surface (wavy, pockmarked) |
| .2 | Interference colors (slight selective leaching) |
| .3 | Tenacious thin whitish layer (stronger selective leaching) |
| .4 | Loosely adhering thick layer (Surface crust) |
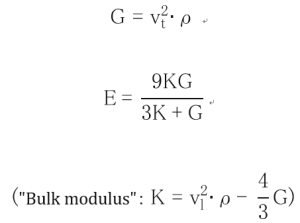
| vt: | Speed of sound of transverse waves (m/s) |
| vl: | Speed of sound of longitudinal waves (m/s) |
| ρ: | Density (kg/m3) |


In this catalog, the measured values are rounded to the first integer and the grades classified according to Table 9.
| Class | 1 | 2 | 3 | 4 | 5 | 6 | 7 |
| Knoop Hardness | <150 | ≧150 <250 | ≧250 <350 | ≧350 <450 | ≧450 <550 | ≧550 <650 | ≧650 |

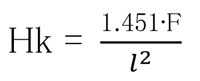
| Aa : | Abrasion |
| W : | Abrasion mass of sample (g) |
| W0 : | Abrasion mass (g) of standard sample |
| d : | Sample density (g / cm3) |
| d0 : | Standard sample density (g / cm3) |

Optical glass is usually isotropic, with its optical properties (refractive indices, scattering, transmission, etc.) independent of its orientation. However, when mechanical or thermal stress is exerted upon it, distortion or stress occurs in the glass and it shows birefringence. Stress F [Pa], optical path difference σ [nm] and thickness of glass d [cm] have the following relationship:

Refractive indices and Abbe number, which are given in this catalog, are
the representative value of plural melting lots. The values of the melting lot
delivered will be within the tolerances specified below:
[ Optical Glass for Polished Lenses ]
nd : ±30×10-5
νd : ± 0.5% (rounded up to the guaranteed number of digits)
Upon special request, and depending upon the glass types, the following
tolerances can be accepted :
nd : ±20×10-5
νd : ±0.3% (rounded up to the guaranteed number of digits)
In the supply of our standard products, Melt Data is attached and includes
the following data :
– Refractive indices: the measurement values of each spectral lines (C, d, F, g ).
These are shown to 5 decimal places. (effective number: six digits)
– Abbe numberνd: the calculated value by the measured refractive indices.
These are shown to 1 or 2 decimal places.
e.g. S-BSL7
nd : 1.51633 ± 0.00030
νd : 64.14 ± 0.33
For special requirements, other than what is mentioned above, please contact us.
[ Optical Glass for Glass Mold Lenses ]
RC value : Standard RC value± 30 (Raw material control value)
νd : ± 0.5% (rounded to the guaranteed number of digits)
When products are supplied, the RC value is given to Melt No..
This RC value is Δnd at 5 decimal places concerning the material that
underwent OHARA’s standard annealing (-600°C per day). The RC value is
rounded to 4 decimal places and shows with a unit of 10-5.
And it comes with a report of theνd value to 1 or 2 decimal places concerning the
product after annealing as specified in catalog annealing (-200°C per day).
e.g. L-BSL7
RC value : -30 ± 30
νd : 64.06 ± 0.33
The standard measurement accuracy for refractive index and dispersion is
as follows :
Refractive index : ±3×10⁻⁵
Dispersion : ±2×10⁻⁵
On request, we shall measure at precision accuracy as follows :
Refractive index : ±1×10⁻⁵
Dispersion : ±3×10⁻⁶
For ultra-precision measurements and reading at spectral lines not
described in this catalog, please contact us.
In case that glass retains residual strain, this can be observed as optical birefringence.
The amount of stress is measured by optical path differences and specified in nm/cm.
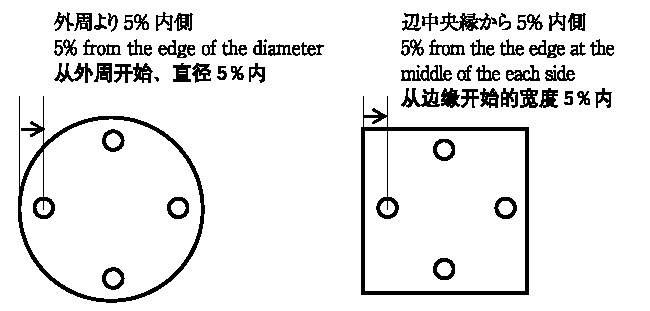
On special request, when we measure stress birefringence in detail,
a rectangular plate is measured 4 points located 5% from the edge at the middle of the each side.
A disc is measured at 4 points located 5% fromthe edge of the diameter.
The maximum value of the 4 points is shown as the birefringence value and is categorized based on Table 11.
For other special forms and shapes the points to be measured will be determined.
| Striae Class | Striae Content Using Striaescope |
|---|---|
| 1 | No visible striae |
| 2 | Striae is light and scattered |
| 3 | Striae is heavier than Class 2 |
For glass used in very precise lens systems it is sometimes necessary to measure the refractive index variation across a blank. In such cases, Ohara pays special attention to each process and can supply high homogeneity glass. The homogeneity is measured in accordance with ISO 17411 by calculating the Peak to Valley (PV) value of refractive index variation (excluding linear change component of refractive index) using computer analysis of the transmitted wavefront of a plano-plano glass sample with a phase-measuring interferometer. In cases where the value of the refractive index variation (PV) must be guaranteed within 4×10⁻⁵, measurement of an individual part is conducted and the value of the refractive index variation (PV) is guaranteed at six decimal places(10-6).
Note: The homogeneity of our standard glass products could exceed PV (Range) 4×10⁻⁵, depending on glass type, dimensions, shape, etc.
| Class | 1 | 2 | 3 | 4 | 5 |
|---|---|---|---|---|---|
| 100cm3The total cross section of bubbles(mm2/100cm3) | <0.03 | ≧0.03 <0.1 | ≧0.1 <0.25 | ≧0.25 <0.5 | ≧0.5 |
In case that glass retains residual strain, this can be observed as optical birefringence.
The amount of stress is measured by optical path differences and specified in nm/cm.
On special request, when we measure stress birefringence in detail, a rectangular plate is measured 4 points located 5% from the edge at the middle of each side.
A disc is measured at 4 points located 5% from the edge of the diameter.
The maximum value of the 4 points is shown as the birefringence value and is categorized based on Table 11.
For other special forms and shapes, the points to be measured will be determined.
Table 11
| Class | 1 | 2 | 3 | 4 |
| Birefringence(nm/cm) | <5 | ≧5 <10 | ≧10 <20 | ≧20 |